
Introducing a free, rigorous cross-section analysis tool
- check out the program and its documentation.
Over the past few months I have been creating and refining a package in python that calculates structural properties for any cross-section imaginable and displays the internal stresses on the section resulting from any combination of design actions. It is finally at a point where I’m ready to share it and its output has been verified through comparison of section property data for standard steel sections.
The motivation for the creation of this software is the lack of a free and rigorous analysis tool that can be used to calculate section properties for complex, built up sections. In developing the program, I also realised that the stress verification of cross-sections subject to multiple design actions can be streamlined through the visualisation of stress contour plots.
This post is intended to introduce the package and highlight its capabilities and simplicity of operation. Later posts will detail the theory behind the calculation of each section property and reveal the inner workings of the package.
Calculated cross-section properties
The program applies the finite element method to calculate the following cross-section properties:
-
Area Properties: Area, elastic centroid, first and second moments of area, elastic section moduli, radii of gyration, principal bending axis rotation angle, second moments of area, elastic section moduli and radii of gyration about the principal bending axis, plastic centroid (for bending about the centroidal and principal axes), plastic section moduli (for bending about the centroidal and principal axes) and corresponding shape factors.
-
Warping Properties: St. Venant torsion constant, warping constant, shear centre, shear areas (for shear loading about global and principal axes).
-
Composite Section Properties: as above but modulus weighted for composite sections.
Stress Analysis
The program allows the user to enter the following design actions:
- Axial force
- Bending moments about the x and y axes
- Bending moments about the principal axes
- Torsion moment
- Shear forces in the x and y directions
The following stress plots will then be generated: axial, bending, torsion, transverse shear, combined normal, combined shear and von Mises.
Try it yourself!
If you have a basic understanding of python, the package is very simple to use. Head over to GitHub to download the program and check out the documentation. If you have trouble with anything, including getting the package up and running, performing an analysis or find any bugs, feel free to leave a comment below or flick me an email.
Example analysis: 150 x 90 x 12 UA
A cross-section analysis is performed on an unequal angle section (150D x 90W x 12THK). A mesh size of 2.5 mm2 is used. The following design actions are applied to determine the cross-section stresses:
- Axial force = -50 kN
- Bending moment about x-axis = 3 kN.m
- Bending moment about y-axis = 5 kN.m
- Torsion moment = 1 kN.m
- Transverse shear force in the x-direction = 5 kN
- Transverse shear force in the y-direction = 3 kN
The following code executes the analysis:
import sectionproperties.pre.sections as sections
from sectionproperties.analysis.cross_section import CrossSection
# create angle geometry
geometry = sections.AngleSection(d=90, b=150, t=12, r_r=10, r_t=5, n_r=16)
# create a finite element mesh
mesh = geometry.create_mesh(mesh_sizes=[2.5])
# create a CrossSection analysis object
section = CrossSection(geometry, mesh)
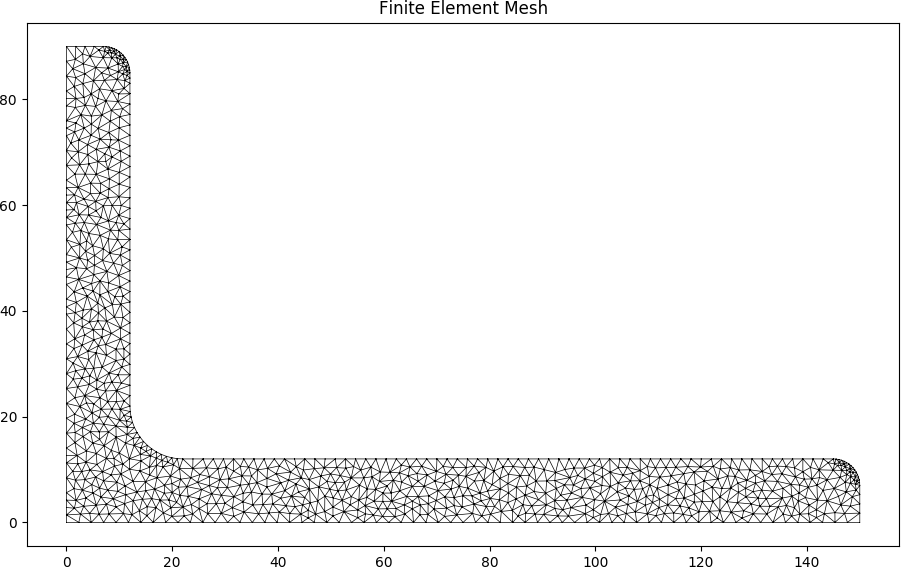
section.plot_mesh() # plot the mesh
# perform a geometric, warping and plastic analysis
section.calculate_geometric_properties()
section.calculate_warping_properties()
section.calculate_plastic_properties()
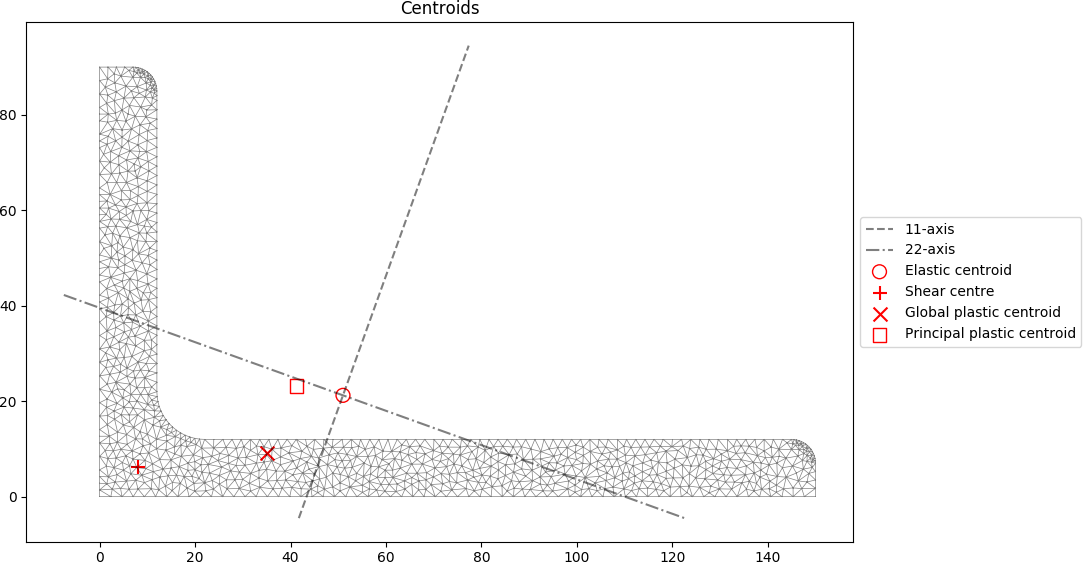
section.plot_centroids() # plot the centroids
section.display_results() # print the results to the terminal
# perform a stress analysis
stress_post = section.calculate_stress(N=-50e3, Mxx=3e6, Myy=5e6, Mzz=1e6, Vx=5e3, Vy=3e3)
# generate various stress plots
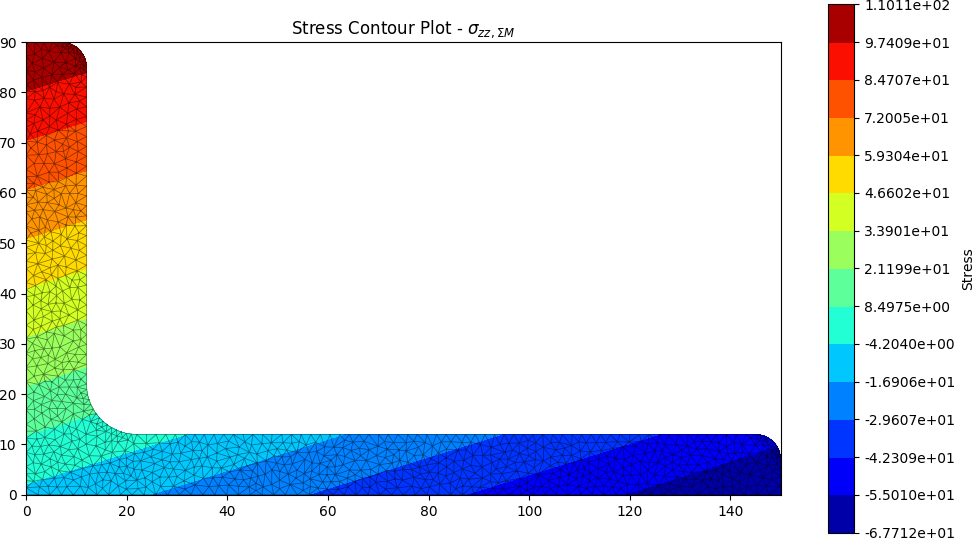
stress_post.plot_stress_m_zz()
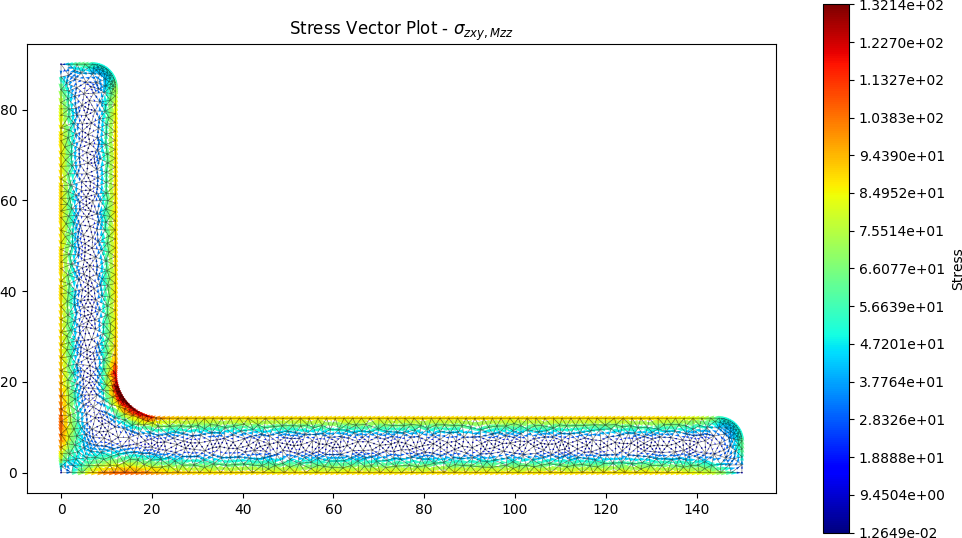
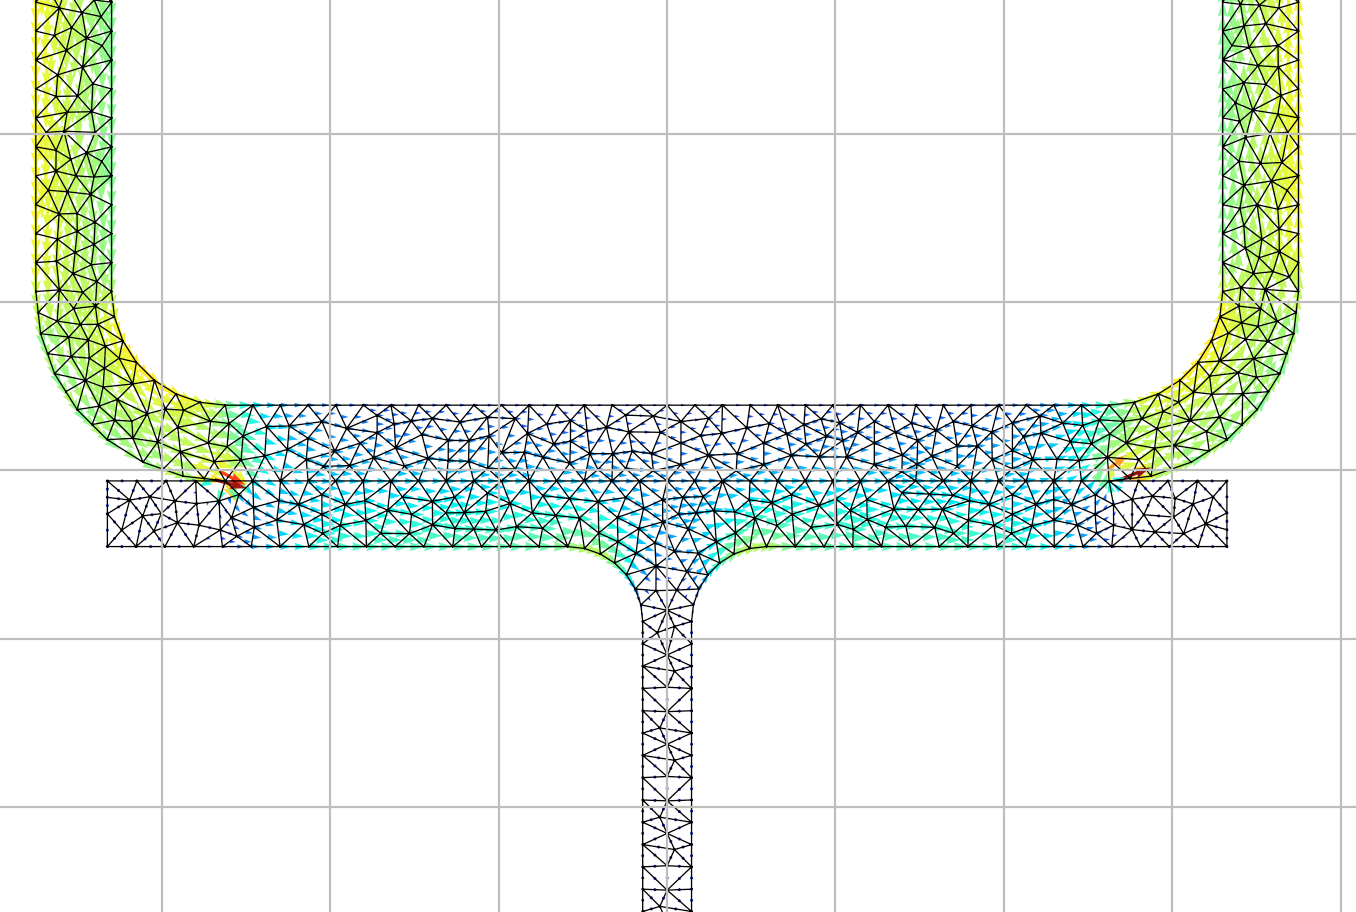
stress_post.plot_vector_mzz_zxy()
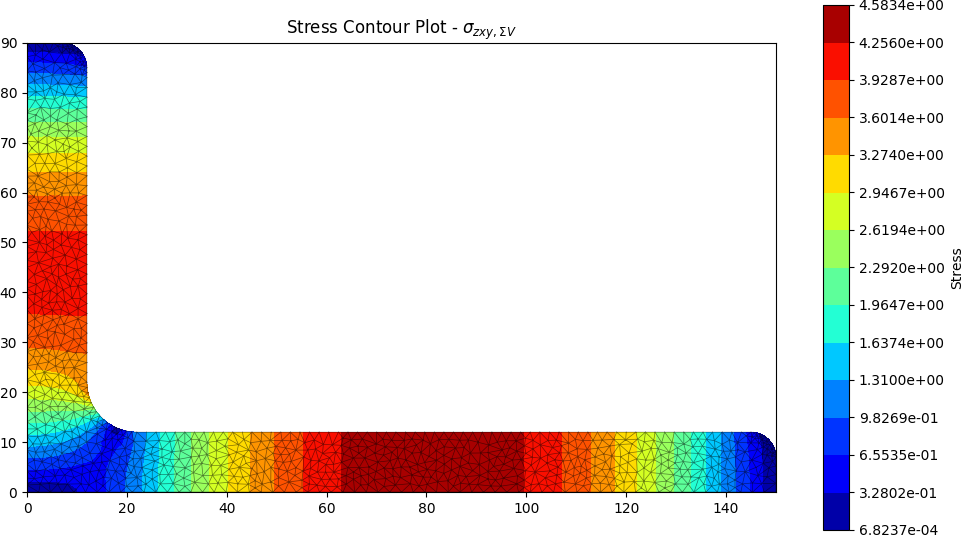
stress_post.plot_stress_v_zxy()
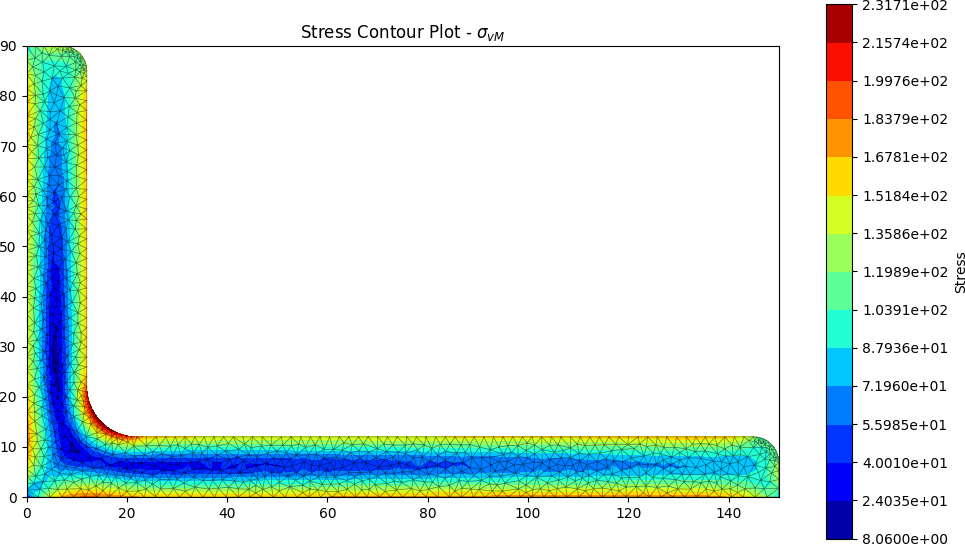
stress_post.plot_stress_vm()
The mesh used for warping analysis is shown below:
The centroidal locations are shown in the figure below:
Selected annotated section property output is displayed below:
Section Properties:
A       = 2.746802e+03
Qx      = 5.830492e+04
Qy      = 1.400609e+05
cx      = 5.099052e+01
cy      = 2.122648e+01
Ixx_g   = 2.956635e+06
Iyy_g   = 1.342903e+07
Ixy_g   = 1.086790e+06
Ixx_c   = 1.719027e+06
Iyy_c   = 6.287252e+06
Ixy_c   = -1.886209e+06
Zxx+    = 2.499548e+04
Zxx-    = 8.098504e+04
Zyy+    = 6.350151e+04
Zyy-    = 1.233023e+05
rx      = 2.501657e+01
ry      = 4.784282e+01
phi     = -1.097749e+02
I11_c   = 6.965394e+06
I22_c   = 1.040885e+06
Z11+    = 6.940943e+04
Z11-    = 9.775801e+04
Z22+    = 2.796114e+04
Z22-    = 2.076484e+04
r11     = 5.035692e+01
r22     = 1.946649e+01
J       = 1.353366e+05
Iw      = 1.623154e+08
x_se    = 8.115249e+00
y_se    = 6.120090e+00
x_st    = 8.115249e+00
y_st    = 6.120090e+00
x1_se   = 2.872133e+01
y2_se   = -3.523602e+01
A_sx    = 1.539903e+03
A_sy    = 8.581861e+02
x_pc    = 3.509985e+01
y_pc    = 9.158374e+00
Sxx     = 4.572966e+04
Syy     = 1.135470e+05
SF_xx+  = 1.829517e+00
SF_xx-  = 5.646679e-01
SF_yy+  = 1.788099e+00
SF_yy-  = 9.208825e-01
x11_pc  = 4.125339e+01
y22_pc  = 2.311568e+01
S11     = 1.210365e+05
S22     = 4.376384e+04
SF_11+  = 1.743805e+00
SF_11-  = 1.238124e+00
SF_22+  = 1.565166e+00
SF_22-  = 2.107593e+00
Selected stress analysis plots are shown below:


Leave a comment